Category:University of Queensland pitch drop experiment charts
Jump to navigation
Jump to search
Media in category "University of Queensland pitch drop experiment charts"
The following 9 files are in this category, out of 9 total.
-
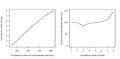 Graph describing the pitch drop experiment.pdf 1,547 × 766; 179 KB
-
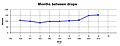 Pitch drop experiment graph - 2.jpg 1,338 × 513; 56 KB
-
 Pitch Drop Experiment graph.svg 1,337 × 513; 27 KB
-
 University of Queensland pitch drop experiment with demarcation of years and major events.png 11,000 × 2,700; 2.32 MB
-
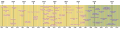
 University of Queensland pitch drop experiment with demarcation of years and months.png 11,000 × 2,700; 177 KB
-
-
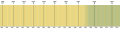
 University of Queensland pitch drop experiment with demarcation of years.png 11,000 × 2,700; 176 KB
-
 University of Queensland pitch drop experiment with notation of major events.png 11,000 × 2,700; 2.13 MB
-
 University of Queensland pitch drop experiment.png 11,000 × 2,700; 176 KB