Category:Human populations
Jump to navigation
Jump to search
English: A population is the collection of people—or organisms of a particular species—living in a given geographic area.
English: Contains "early species of Homo" as a subcategory. Anything after the Lower Paleolithic, including "archaic humans" can not be described as "early species", so this category can group the ill-defined spectrum of species-subspecies-race-ethnicity.
humans that live in the same locality .jpg) | |||||
| Upload media | |||||
| Subclass of |
| ||||
|---|---|---|---|---|---|
| Has part(s) |
| ||||
| Different from | |||||
| |||||
Subcategories
This category has the following 11 subcategories, out of 11 total.
E
G
H
K
L
O
P
R
T
W
Media in category "Human populations"
The following 75 files are in this category, out of 75 total.
-
 01Hokkaido 北海道人口ピラミッド 2015-10-01.gif 1,278 × 2,130; 38 KB
-
 02Aomori 青森県人口ピラミッド 2015-10-01.gif 1,278 × 2,130; 38 KB
-
 03Iwate 岩手県人口ピラミッド 2015-10-01.gif 1,278 × 2,130; 34 KB
-
 04Miyagi 宮城県人口ピラミッド 2015-10-01.gif 1,278 × 2,130; 44 KB
-
 05Akita 秋田県人口ピラミッド 2015-10-01.gif 1,278 × 2,130; 34 KB
-
 06Yamagata 山形県人口ピラミッド 2015-10-01.gif 1,278 × 2,130; 34 KB
-
 07Fukushima 福島県人口ピラミッド 2015-10-01.gif 1,278 × 2,130; 43 KB
-
 1 F 870.jpg 3,338 × 1,146; 463 KB
-
 Aktifis Lingkungan Hidup.jpg 5,184 × 3,456; 7.73 MB
-
 Albanian-people-around-the-world.png 1,024 × 460; 105 KB
-
 Antadavainės kaimas 1765m.jpg 2,456 × 984; 1.04 MB
-
 Apple iPhone 8 for NRFU Operation in 2020 US Census 1.jpg 436 × 942; 38 KB
-
 Apple iPhone 8 for NRFU Operation in 2020 US Census 2.jpg 434 × 938; 46 KB
-
 Apple iPhone 8 for NRFU Operation in 2020 US Census 3.jpg 435 × 937; 37 KB
-
 Apple iPhone 8 for NRFU Operation in 2020 US Census 4.jpg 441 × 937; 37 KB
-
 Apple iPhone 8 for NRFU Operation in 2020 US Census 5.jpg 438 × 941; 40 KB
-
 Bevölkerungstabelle2006.png 937 × 648; 27 KB
-
 CanadaridingspopulationtoLAcountypopulation.svg 1,046 × 818; 1.88 MB
-
 Cities in Africa East.png 1,344 × 743; 64 KB
-
 Cities in Africa West.png 1,344 × 743; 53 KB
-
 Cities in Asia East.png 1,344 × 743; 55 KB
-
 Cities in Asia North.png 1,344 × 743; 80 KB
-
 Cities in Asia South.png 1,344 × 743; 53 KB
-
 Cities in Asia southeast.png 1,344 × 743; 78 KB
-
 Cities in Asia West.png 1,344 × 743; 67 KB
-
 Cities in Central America South.png 1,344 × 743; 55 KB
-
 Cities in Central America West.png 1,344 × 743; 47 KB
-
 Cities in Europe Central.png 1,344 × 743; 65 KB
-
 Cities in Europe East.png 1,344 × 743; 67 KB
-
 Cities in Europe North.png 1,344 × 743; 60 KB
-
 Cities in Europe South.png 1,344 × 743; 56 KB
-
 Cities in Europe West.png 1,344 × 743; 62 KB
-
 Cities in India East.png 1,344 × 743; 66 KB
-
 Cities in India South.png 1,344 × 743; 56 KB
-
 Cities in India West.png 1,344 × 743; 67 KB
-
 Cities in Middle East.png 1,344 × 743; 68 KB
-
 Cities in North America East.png 1,344 × 743; 48 KB
-
 Cities in North America South.png 1,344 × 743; 62 KB
-
 Cities in North America West.png 1,344 × 743; 59 KB
-
 Cities in Oceania.png 1,344 × 743; 38 KB
-
 Cities in South America East.png 1,344 × 743; 52 KB
-
 Cities in South America West.png 1,344 × 743; 64 KB
-
 Cities in UK and France.png 1,344 × 743; 60 KB
-
 Distribution of Population in Malappuram District.svg 1,415 × 1,670; 2.62 MB
-
 Germany migrant percentage by age.jpg 1,067 × 583; 155 KB
-
 Golla's Population.jpg 5,676 × 4,284; 4.73 MB
-
 Human History AR.svg 800 × 480; 1.28 MB
-
 Illustration of past, present and future population sizes (Our World in Data).png 1,781 × 2,418; 2.51 MB
-
 Kirkuk Demographics.jpg 1,046 × 708; 154 KB
-
 Magyar települések.png 896 × 444; 50 KB
-
 Mannfjöldaþróun eftir svæðum.png 697 × 547; 51 KB
-
 Odsetek Ślązaków w powiatach województw śląskiego i opolskiego z roku 2011.png 1,318 × 1,218; 4.59 MB
-
 Overlap between future population distribution and extreme heat.jpg 4,387 × 1,814; 1.97 MB
-
 Pie chart Tizi-ouzou.jpg 480 × 503; 31 KB
-
 Population de Gray entre 2012 et 2018.jpg 1,990 × 1,377; 197 KB
-
 Population density in Ukraine.png 2,575 × 1,930; 634 KB
-
 Population du Venezuela 1970-2020.png 1,044 × 815; 43 KB
-
 Population of Borgomanero in the last years.svg 3,382 × 1,724; 14 KB
-
 Population of Chippenham with Estimate.png 991 × 717; 19 KB
-
 Population Pyramid 5 Stages.png 6,000 × 1,472; 136 KB
-
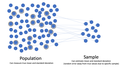 Population versus sample (statistics).png 2,249 × 1,265; 475 KB
-
 Population-growth-rate-with-and-without-migration.png 3,197 × 1,860; 306 KB
-
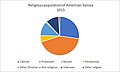 PopulationAmericanSamoa.jpg 724 × 434; 32 KB
-
 Porto Alegre Population Compared to Other Brazilian Cities (Pie Graph).png 1,350 × 824; 84 KB
-
 Regroupement d'âges (ville de Tizi Ouzou).png 854 × 372; 21 KB
-
 SNP haplotype sharing between worldwide populations.png 602 × 905; 345 KB
-
 Total Muslim Adherents.png 726 × 436; 16 KB
-
 Total Muslim adherents.png 722 × 436; 16 KB
-
 Uniform Systematic Distribution terbaru.png 452 × 389; 9 KB
-
 US Fertility Rates 1963-1981.png 3,543 × 2,415; 247 KB
-
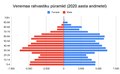 Venemaa rahvastiku püramiid (2020.aasta andmetel).pdf 1,250 × 772; 26 KB
-
 Waschbär, Zyklus 2b.png 1,366 × 768; 91 KB
-
 Évolution historique de la population de Tizi Ouzou.jpg 480 × 633; 103 KB
-
 תרחישי אוכלוסיה.jpg 1,280 × 720; 81 KB
-
 תרחישי גידול אוכלוסיה.png 1,262 × 1,080; 67 KB


.png)


.png)


.png)
.png)


