Category:Environmental diagrams
Jump to navigation
Jump to search
Subcategories
This category has only the following subcategory.
E
Media in category "Environmental diagrams"
The following 71 files are in this category, out of 71 total.
-
 Atmosphaerenzusammensetzung.svg 2,494 × 2,189; 269 KB
-
 Atmosphere composition diagram mk.svg 2,494 × 2,189; 3.72 MB
-
 Atmosphere composition diagram-en.svg 2,494 × 2,189; 295 KB
-
 Atmosphere composition diagram-no.svg 2,494 × 2,189; 387 KB
-
 Atmosphere composition diagram.jpg 800 × 715; 100 KB
-
 Aérosols carbonés.png 797 × 662; 107 KB
-
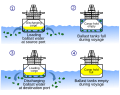 Ballast water en.svg 512 × 402; 27 KB
-
 Ballast water fr.svg 512 × 402; 27 KB
-
 Biomagnification GIF.gif 1,000 × 736; 432 KB
-
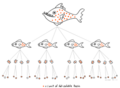 Biomagnification.png 5,531 × 4,067; 1.53 MB
-
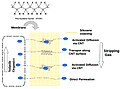 Carbon nanotubes (CNTs) combine to membrane.jpg 1,102 × 820; 178 KB
-
 Categories d'impact.jpeg 582 × 244; 53 KB
-
 Categories d'impacts.jpeg 565 × 238; 51 KB
-
 Chart flux sumarizing the zero valence copper method preparation.tif 642 × 441; 62 KB
-
 Chemical reduction step for nZVI synthesis.tif 644 × 314; 74 KB
-
 Classes of stresses that plants are exposed to.jpg 2,420 × 2,011; 870 KB
-
 CSO diagram US EPA.jpg 988 × 448; 74 KB
-
 CSO diagram US EPA.svg 443 × 201; 1.37 MB
-
 Diagrama vertical.xcf 2,386 × 1,084; 981 KB
-
 Diffusion scrub.gif 541 × 208; 9 KB
-
 Dimension humana.xcf 2,395 × 340; 298 KB
-
 Dimension natural.xcf 2,395 × 404; 345 KB
-
 Direct Air Capture.jpg 1,880 × 1,410; 515 KB
-
 Données rU.jpeg 656 × 368; 69 KB
-
 Données.jpeg 750 × 421; 85 KB
-
 Energy-and-economics1.png 980 × 673; 644 KB
-
 Estrategias de biorremediación.jpg 1,920 × 1,080; 111 KB
-
 Euri azidoa.jpg 501 × 308; 57 KB
-
 Eutrophication Diagram.pdf 1,500 × 937; 33 KB
-
 Fig 1.PNG 484 × 284; 58 KB
-
 Figure 1 Sources of Nutrient Pollution to Water Bodies (37691112436).jpg 1,643 × 1,479; 259 KB
-
 Figure of a drainage basin.svg 512 × 275; 643 KB
-

-
 Flowchart for obtaining the TiO2-CNDs nanoparticle.tif 546 × 520; 63 KB
-

-
 Flux.jpeg 1,457 × 850; 125 KB
-
 Formation de l'acide nitrique.png 662 × 533; 47 KB
-
 Global Energy Budget Diagram.png 2,500 × 1,773; 2.61 MB
-
 Graph of Impervious Surfaces Coverage in the US.png 1,200 × 742; 72 KB
-
 Habitat Fragmentation.png 1,324 × 742; 507 KB
-
 Impacto antropogenico.xcf 2,386 × 370; 352 KB
-
 Iron+sulfate reduction.jpg 839 × 648; 808 KB
-
 Krithi Sundar - APES final project.jpg 960 × 720; 77 KB
-
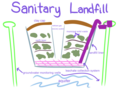 LANDFILL.png 1,442 × 1,080; 239 KB
-

-
 Maximum-sustainable-yield-of-fish-with-addition.png 5,230 × 4,910; 624 KB
-
 Modélisation graphique systeme.jpeg 1,287 × 571; 74 KB
-
 Modélisation graphique.jpeg 868 × 600; 68 KB
-
 Multieffekt von Luftschadstoffen.jpg 2,000 × 1,552; 1.06 MB
-
 Nanocomposite membrane.tif 724 × 1,098; 203 KB
-
 Natural & impervious cover diagrams EPA.jpg 762 × 367; 104 KB
-
 Nitrogen Cycle 氮素循環.svg 800 × 600; 85 KB
-
 Ostromislensky reaction.png 906 × 352; 12 KB
-
 Phosphorkreislauf.jpg 1,200 × 849; 154 KB
-
 Phosphorus cycle.png 538 × 304; 108 KB
-
 PUNTUACIÓ DE LES FAMÍLIES DE macroinvertebrats PER OBTENIR BMWP '.jpg 1,261 × 397; 152 KB
-
 Result Dech.jpeg 346 × 317; 14 KB
-
 Result RU.jpeg 379 × 319; 17 KB
-
 Salt water intrusion wikipedia2.png 9,983 × 6,249; 13.69 MB
-

-
 SLOSS graphic.jpg 512 × 512; 72 KB
-
 Soil Salinization Color.png 5,370 × 3,642; 1.8 MB
-
 Soil Salinization Grayscale.png 5,321 × 3,619; 1.79 MB
-

-
 Thermochemical conversion of the residue of a medicinal herb.tif 644 × 352; 102 KB
-
 Trophic Cascade.jpg 3,300 × 2,550; 412 KB
-
 Undiscovered species chart.png 600 × 463; 48 KB
-
 Water abstraction in Europe in 2015-2017.jpg 968 × 675; 69 KB
-
 Water abstrating by source.jpg 2,143 × 1,019; 153 KB
-
 Water clarity metrics figure Turner 2022 Limnology and Oceanography Letters.jpg 1,200 × 1,200; 253 KB
-
 Water urban cycel.jpg 858 × 1,011; 63 KB


_combine_to_membrane.jpg)


.jpg)


