Category:Categories per capita
Jump to navigation
Jump to search
English: Categories which show statistics converted to the number of persons which are involved.
Latin phrase; "by heads"/"for each head" | |||||
| Upload media | |||||
| Instance of | |||||
|---|---|---|---|---|---|
| Facet of | |||||
| |||||
Subcategories
This category has the following 14 subcategories, out of 14 total.
Media in category "Categories per capita"
The following 121 files are in this category, out of 121 total.
-
 2019 Gun suicides per capita - by country.svg 1,200 × 675; 3 KB
-

-
 Adolescent birth rate, OWID.svg 850 × 600; 87 KB
-
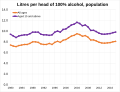 Alcohol consumption rate in the United Kingdom.svg 2,504 × 1,916; 24 KB
-
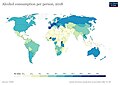
 Alcohol-consumption-per-person-us.jpg 3,400 × 2,400; 133 KB
-
 Annual healthcare expenditure per capita, OWID.svg 850 × 600; 140 KB
-

-
 Average per capita supply of pulses, OWID.svg 850 × 600; 12 KB
-
 Beer consumption per person in the UK.svg 850 × 600; 31 KB
-
 BNPperhoofd2013-2019.png 1,350 × 1,250; 104 KB
-
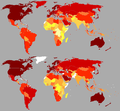
 Cardiovascular-disease-death-rate-over-time-males-vs-females.png 3,400 × 3,398; 896 KB
-
 Cardiovascular-disease-death-rates.png 3,400 × 2,400; 737 KB
-
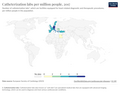 Catheterization-labs-per-million-people.png 3,400 × 2,643; 914 KB
-
-
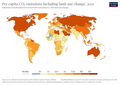
 Co-emissions-per-capita-map.png 3,400 × 2,700; 913 KB
-
 CO2 emissions per capita, 2016 (Our World in Data).svg 850 × 600; 155 KB
-
 CO2 emissions per capita, 2017 (Our World in Data).svg 850 × 600; 155 KB
-
 CO2-emissions-per-capita-map.png 3,400 × 2,706; 1,002 KB
-
 CO2-emissions-per-capita.png 3,400 × 2,706; 767 KB
-
 Co2-per-capita-marimekko (OWID 0184).png 850 × 600; 75 KB
-
 Daily meat consumption per person.svg 850 × 600; 163 KB
-
 Daily-caloric-supply-derived-from-carbohydrates-protein-and-fat.png 3,400 × 2,400; 468 KB
-
 Dalys-from-autistic-spectrum-disorders.png 3,400 × 2,400; 742 KB
-
 Dalys-particulate-matter.png 3,400 × 2,400; 730 KB
-
 Death-rate-from-rheumatic-heart-disease-who-ghe-age-standardized.png 3,400 × 2,857; 1,000 KB
-
 Death-rate-smoking.png 3,082 × 1,836; 487 KB
-
 Deaths-from-smallpox-per-1000-population.png 3,400 × 2,765; 849 KB
-
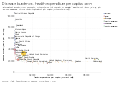 Disease burden vs. health expenditure per capita, OWID.svg 850 × 600; 34 KB
-
 Disease-burden-rates-from-cancers (1).png 3,400 × 2,400; 741 KB
-
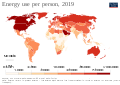 Energy use per person 2019 - OWID.svg 850 × 600; 153 KB
-
 Expected years of living with disability or disease burden, OWID.svg 850 × 600; 140 KB
-
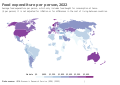 Food expenditure per person per year, OWID.svg 850 × 600; 139 KB
-
 GDP (PPP) per capita, 2012 IMF.jpg 3,600 × 1,640; 534 KB
-
 Hazardous-waste-generated-per-capita.png 3,400 × 2,400; 833 KB
-
 Health expenditure and financing, per capita, OWID.svg 850 × 600; 19 KB
-
 Hiv-death-rates (1).png 3,400 × 2,400; 731 KB
-
 Human welfare and ecological footprint.jpg 850 × 522; 182 KB
-
 Imported-or-exported-co-emissions-per-capita (OWID 0496).png 850 × 600; 112 KB
-
 Incidence-of-tuberculosis-sdgs.jpg 3,400 × 2,975; 449 KB
-
 Incidence-of-tuberculosis-sdgs.png 3,400 × 2,905; 985 KB
-
 Infectious-and-parasitic-diseases-death-rate-who-mdb.jpg 3,400 × 3,718; 833 KB
-
 Intensive-care-beds-per-100000.png 3,400 × 2,400; 781 KB
-
 Mapa dos estados brasileiros por renda per capita (2023).png 752 × 726; 52 KB
-
 Material-footprint-per-capita (OWID 0550).png 850 × 600; 37 KB
-
 Meat Supply per Person.svg 850 × 600; 164 KB
-
 Mismanaged-plastic-waste-per-capita (OWID 0656).png 850 × 600; 110 KB
-
 Motor vehicle ownership, per 1000 inhabitants, OWID.svg 850 × 600; 140 KB
-
 Out-of-pocket expenditure per capita on healthcare, OWID.svg 850 × 600; 15 KB
-
 Per capita CO₂ emissions in 2016 vs 1990, OWID.svg 850 × 600; 37 KB
-
 Per capita meat consumption by type, OWID.svg 850 × 600; 15 KB
-

-

-
 Per capita milk consumption, OWID.svg 850 × 600; 140 KB
-
 Per capita milk supply vs. GDP per capita, OWID.svg 850 × 600; 32 KB
-
 Per capita mismanaged plastic waste, OWID.svg 850 × 600; 140 KB
-
 Per capita municipal waste generation, OWID.svg 850 × 600; 141 KB
-
 Per capita plastic waste vs. GDP per capita, OWID.svg 850 × 600; 30 KB
-
 Per capita renewable freshwater resources, OWID.svg 850 × 600; 8 KB
-
 Per capita sugar food supply vs GDP per capita, OWID.svg 850 × 600; 33 KB
-
 Per-capita-co-emissions-vs-human-development-index.svg 850 × 696; 84 KB
-
 Per-capita-co2-aviation (OWID 0794).png 850 × 600; 93 KB
-
 Per-capita-co2-aviation-adjusted.svg 850 × 600; 168 KB
-
 Per-capita-co2-by-fuel (OWID 0792).png 850 × 600; 62 KB
-
 Per-capita-co2-cement (OWID 0795).png 850 × 600; 90 KB
-
 Per-capita-co2-coal (OWID 0793).png 850 × 600; 91 KB
-
 Per-capita-co2-domestic-aviation (OWID 0790).png 850 × 600; 111 KB
-
 Per-capita-co2-domestic-aviation-vs-gdp (OWID 0796).png 850 × 600; 89 KB
-
 Per-capita-co2-domestic-aviation-vs-land-area (OWID 0791).png 850 × 600; 82 KB
-
 Per-capita-co2-flaring (OWID 0789).png 850 × 600; 92 KB
-
 Per-capita-co2-food-deforestation (1).svg 850 × 600; 167 KB
-
 Per-capita-co2-fuel (OWID 0786).png 850 × 600; 42 KB
-
 Per-capita-co2-gas (OWID 0788).png 850 × 600; 91 KB
-
 Per-capita-co2-including-land (OWID 0785).png 850 × 600; 109 KB
-
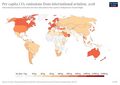 Per-capita-co2-international-aviation (OWID 0784).png 850 × 600; 104 KB
-
 Per-capita-co2-international-flights-adjusted (OWID 0783).png 850 × 600; 118 KB
-
 Per-capita-co2-oil (OWID 0781).png 850 × 600; 91 KB
-
 Per-capita-co2-region (OWID 0782).png 850 × 600; 54 KB
-
 Per-capita-co2-sector (OWID 0780).png 850 × 600; 47 KB
-
 Per-capita-co2-transport (OWID 0779).png 850 × 600; 98 KB
-
 Per-capita-co2-vs-average (OWID 0778).png 850 × 600; 106 KB
-
 Per-capita-coal (OWID 0776).png 850 × 600; 45 KB
-

-
 Per-capita-domestic-aviation-km (OWID 0775).png 850 × 600; 59 KB
-
 Per-capita-food-losses-waste (OWID 0765).png 850 × 600; 68 KB
-
 Per-capita-ghg-emissions.png 3,400 × 2,400; 849 KB
-
 Per-capita-international-aviation-km (OWID 0759).png 850 × 600; 116 KB
-
 Per-capita-km-aviation (OWID 0757).png 850 × 600; 114 KB
-
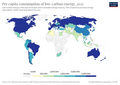 Per-capita-low-carbon-energy (OWID 0756).png 850 × 600; 108 KB
-
 Per-capita-low-carbon-vs-gdp (OWID 0755).png 850 × 600; 85 KB
-
-
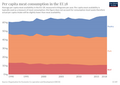 Per-capita-meat-eu28 (OWID 0754).png 850 × 600; 62 KB
-
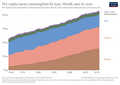
 Per-capita-meat-type (OWID 0752).png 850 × 600; 81 KB
-
 Per-capita-meat-usa (OWID 0751).png 850 × 600; 62 KB
-
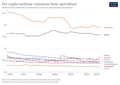 Per-capita-methane-agriculture (OWID 0749).png 850 × 600; 80 KB
-
 Per-capita-methane-emissions (OWID 0750).png 850 × 600; 100 KB
-
 Per-capita-methane-sector (OWID 0746).png 850 × 600; 43 KB
-
-
 Per-capita-nitrous-oxide (OWID 0742).png 850 × 600; 98 KB
-
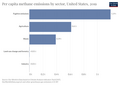
 Per-capita-nitrous-oxide-agriculture (OWID 0747).png 850 × 600; 81 KB
-
 Per-capita-nitrous-oxide-sector (OWID 0744).png 850 × 600; 42 KB
-
 Per-capita-nuclear (OWID 0741).png 850 × 600; 117 KB
-
 Per-capita-ocean-plastic-waste (OWID 0743).png 850 × 600; 109 KB
-
 Per-capita-oil (OWID 0858).png 850 × 600; 50 KB
-
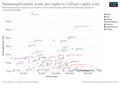
 Per-capita-plastic-waste-vs-gdp-per-capita (OWID 0740).png 850 × 600; 104 KB
-
 Per-capita-sources-of-protein (OWID 0856).png 850 × 600; 73 KB
-
 Per-capita-wind (OWID 0854).png 850 × 600; 121 KB
-
 Pneumonia-death-rates-age-standardized.png 3,400 × 2,700; 922 KB
-
 Pneumonia-mortality-by-age.jpg 2,656 × 1,875; 370 KB
-
 Prevalencecysticercosis.png 2,656 × 1,875; 620 KB
-
 Renewable-water-resources-per-capita (OWID 0862).png 850 × 600; 69 KB
-
 Sales-of-cigarettes-per-adult-per-day (1).svg 4,250 × 3,000; 151 KB
-
 Scientific-publications-per-million.png 3,400 × 2,400; 826 KB
-
 Sulphur dioxide (SO₂) emissions per capita, OWID.svg 850 × 600; 11 KB
-
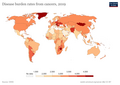
 The-incidence-of-malaria-per-1000-population.jpg 3,400 × 2,400; 263 KB
-
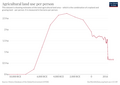 Total-agricultural-land-use-per-person (OWID 1037).png 850 × 600; 49 KB
-
 Total-alcohol-consumption-per-capita-litres-of-pure-alcohol.jpg 3,400 × 2,400; 249 KB
-
 Total-greenhouse-gas-emissions-per-capita (OWID 1031).png 850 × 600; 91 KB
-
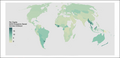
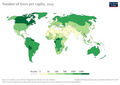 Trees-per-capita (OWID 1132).png 850 × 600; 97 KB
-
 Tuberculosis incidence (per 100,000 people), OWID.svg 850 × 600; 140 KB
-
 Vegetable consumption per capita, OWID.svg 850 × 600; 141 KB
-
 Wind-electricity-per-capita (OWID 1099).png 850 × 600; 96 KB

_emissions_per_person_versus_GDP_per_person_-_scatter_plot.svg)


.svg)
.svg)


.png)


.png)


_per_capita,_2012_IMF.jpg)


.png)

.png)


.png)
.png)

.png)


,_OWID.svg)
,_OWID.svg)


.png)

.png)
.png)
.png)
.png)
.png)
.png)
.png)
.svg)
.png)
.png)
.png)
.png)
.png)
.png)
.png)
.png)
.png)
.png)
.png)
.png)
.png)

.png)
.png)
.png)
.png)
.png)
.png)
.png)
.png)
.png)
.png)
.png)
.png)
.png)
.png)
.png)
.png)
.png)
.png)
.png)
.png)


.png)
.svg)

_emissions_per_capita,_OWID.svg)

.png)

.png)
.png)
,_OWID.svg)

.png)
.png)
.png)