Category:Water statistics
Jump to navigation
Jump to search
Subcategories
This category has the following 9 subcategories, out of 9 total.
Media in category "Water statistics"
The following 78 files are in this category, out of 78 total.
-
 Acesso à água no mundo.svg 1,405 × 601; 359 KB
-
 Agricultural water as a share of total water withdrawals, OWID.svg 850 × 600; 140 KB
-
 Agricultural water withdrawals, OWID.svg 850 × 600; 141 KB
-
 Balance hídrico.jpg 1,573 × 691; 123 KB
-
 Biodiversity Europa freshwaters Temporal fluctuations in trend estimates.webp 2,157 × 1,331; 178 KB
-
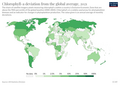 Chlorophyll-a-deviation-from-the-global-average (OWID 0149).png 850 × 600; 114 KB
-
 Decomposition rates of marine debris items, OWID.svg 850 × 600; 8 KB
-
 Drinking water service coverage, OWID.svg 850 × 600; 9 KB
-
 Drinking water services coverage in rural areas, OWID.svg 850 × 600; 8 KB
-
 Drinking water services coverage in urban areas, OWID.svg 850 × 600; 10 KB
-
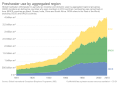 Freshwater use by aggregated region, OWID.svg 850 × 600; 16 KB
-
 Freshwater withdrawals as a share of internal resources, OWID.svg 850 × 600; 139 KB
-
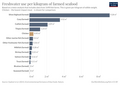
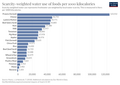
 Freshwater withdrawals of foods per 1000 kilocalories, OWID.svg 850 × 600; 15 KB
-
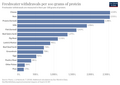
 Freshwater withdrawals per 100 grams of protein, OWID.svg 850 × 600; 12 KB
-
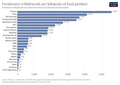
 Freshwater withdrawals per kilogram of food product, OWID.svg 850 × 600; 17 KB
-
 Freshwater-use-seafood (OWID 0391).png 850 × 600; 67 KB
-
 Freshwater-withdrawals-per-1000kcal (OWID 0487).png 850 × 600; 68 KB
-
 Global freshwater use over the long-run, OWID.svg 850 × 600; 8 KB
-
 GlobalWaterWithdrawals.jpg 516 × 452; 78 KB
-
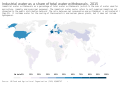 Industrial water as a share of total water withdrawals, OWID.svg 850 × 600; 141 KB
-
 Industrial water withdrawal, OWID.svg 850 × 600; 141 KB
-

-
 Municipal water as a share of total water withdrawals, OWID.svg 850 × 600; 141 KB
-
 Municipal water withdrawal, OWID.svg 850 × 600; 141 KB
-

-
 Number of people using safely managed drinking water, OWID.svg 850 × 600; 140 KB
-

-

-

-

-
 Number of people without access to safe drinking water, OWID.svg 850 × 600; 147 KB
-
 Number without safe drinking water 2020.png 3,400 × 2,400; 812 KB
-
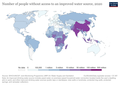 Number-without-improved-water 2020.png 3,400 × 2,400; 773 KB
-
 Per capita renewable freshwater resources, OWID.svg 850 × 600; 8 KB
-
 Percentage of primary schools with access to potable water, OWID.svg 850 × 600; 139 KB
-

-
 Proportion-using-safely-managed-drinking-water (OWID 0887).png 850 × 600; 108 KB
-
 Proportion-using-safely-managed-drinking-water.png 3,400 × 2,400; 855 KB
-
 Pérdida-produccion de agua.jpg 1,835 × 701; 250 KB
-

-
 Requerimientos hídricos.jpg 2,614 × 1,153; 229 KB
-
 Rural-population-with-improved-water (OWID 0962).png 850 × 600; 123 KB
-
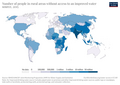 Rural-without-improved-water (OWID 0960).png 850 × 600; 111 KB
-
 Scarcity-water-per-kg-poore (OWID 0955).png 850 × 600; 82 KB
-
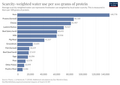 Scarcity-water-protein-poore (OWID 0957).png 850 × 600; 70 KB
-
 Scarcity-water-use-kcals (OWID 0958).png 850 × 600; 77 KB
-
 Sdg-target-on-improved-water-access (OWID 0954).png 850 × 600; 105 KB
-

-
 Share of deaths from unsafe water sources, OWID.svg 850 × 600; 141 KB
-
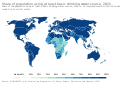
 Share of domestic wastewater that is safely treated, OWID.svg 850 × 600; 139 KB
-
 Share of population using at least basic drinking water source, OWID.svg 850 × 600; 141 KB
-

-

-
 Share of schools with access to basic drinking water, OWID.svg 850 × 600; 6 KB
-
 Share of the population using safely managed drinking water, OWID.svg 850 × 600; 141 KB
-
 Share of the population with access to improved drinking water, OWID.svg 850 × 600; 142 KB
-

-

-
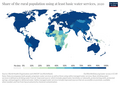
 Share of urban population with improved water sources, OWID.svg 850 × 600; 142 KB
-

-

-
 Statistiky o pitné vodě 1989,2005-2011.jpg 1,201 × 429; 98 KB
-

-

-
 Urban improved water access vs. rural water access, OWID.svg 850 × 600; 43 KB
-
 Wastewater-safely-treated (OWID 1119).png 850 × 600; 91 KB
-
 Wastewater-safely-treated.png 3,400 × 2,400; 834 KB
-
 Water abstract in Europe.tif 746 × 474; 1.47 MB
-
 Water requirement per gram of protein, OWID.svg 850 × 600; 7 KB
-
 Water requirement per kilocalorie, OWID.svg 850 × 600; 9 KB
-
 Water requirement per tonne of food product, OWID.svg 850 × 600; 9 KB
-
 Water withdrawals per capita, OWID.svg 850 × 600; 141 KB
-
 Water-basins-cooperation-plan (OWID 1118).png 850 × 600; 47 KB
-
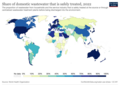
 Water-bodies-good-water-quality (OWID 1117).png 850 × 600; 48 KB
-
 Water-per-protein-poore (OWID 1116).png 850 × 600; 60 KB
-
 Water-withdrawals-per-kg-poore (OWID 1115).png 850 × 600; 71 KB
-
 Waterverbruik.wereldwijd.jpg 320 × 393; 23 KB
-
 Óceán összetétel.jpg 1,120 × 1,131; 113 KB


.png)


.png)
.png)


,_OWID.svg)


.png)

,_OWID.svg)

.png)
.png)
.png)
.png)
.png)
.png)


.png)


.png)
.png)
.png)
.png)

