Category:Oceanographic diagrams
Jump to navigation
Jump to search
Subcategories
This category has the following 13 subcategories, out of 13 total.
B
- Buys Ballot diagrams (7 F)
C
- Coast cross sections (44 F)
D
- Diagrams of mid-ocean ridges (45 F)
E
- ENSO-index (19 F)
N
- Nutrient cycle (21 F)
O
- Oceanic water column (18 F)
S
- Speed of sound in water (9 F)
- Strait schemas (12 F)
T
- Diagrams of tides (95 F)
Media in category "Oceanographic diagrams"
The following 200 files are in this category, out of 387 total.
(previous page) (next page)-
 Recent Sea Level Rise-template.png 800 × 561; 103 KB
-
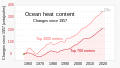
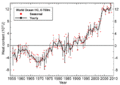
 Ocean Heat Content (2012).png 569 × 380; 32 KB
-
 12 brief lessons about the ocean and the world.svg 1,554 × 981; 841 KB
-
 1955- Ocean heat content - NOAA.svg 1,200 × 675; 4 KB
-
 75mph Wilson Stevenson.png 2,400 × 1,600; 208 KB
-
 Sstday3.svg 563 × 669; 11 KB
-
 Sstnight pol.svg 510 × 675; 11 KB
-
 Acoustic propagation in the Somali basin. (1980) (16150649713).jpg 2,928 × 1,838; 395 KB
-
 Acoustic propagation in the Somali basin. (1980) (16150651223).jpg 2,992 × 1,836; 398 KB
-
 Acoustic propagation in the Somali basin. (1980) (16563300837).jpg 3,008 × 1,808; 414 KB
-
 Acoustic propagation in the Somali basin. (1980) (16563305207).jpg 2,928 × 1,714; 298 KB
-
 Acoustic propagation in the Somali basin. (1980) (16563307257).jpg 2,960 × 1,708; 332 KB
-
 Acoustic propagation in the Somali basin. (1980) (16583004038).jpg 2,992 × 1,704; 327 KB
-
 Acoustic propagation in the Somali basin. (1980) (16583012308).jpg 2,912 × 1,828; 326 KB
-
 Acoustic propagation in the Somali basin. (1980) (16744695556).jpg 2,912 × 1,810; 348 KB
-
 Acoustic propagation in the Somali basin. (1980) (16744700396).jpg 2,992 × 1,692; 306 KB
-
 Acoustic propagation in the Somali basin. (1980) (16769500022).jpg 2,992 × 1,792; 355 KB
-
 Acoustic Release Method ARC1.jpg 2,090 × 1,048; 1.02 MB
-
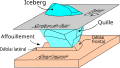 Affouillement glace 3D.svg 454 × 256; 22 KB
-

-
-
 An example of a fixed-point ocean observatory.svg 842 × 595; 2.82 MB
-
 An in situ perspective of a deep pelagic food web.jpg 1,280 × 797; 114 KB
-

-

-
-

-

-
-

-
-

-

-

-
 Analysis of the Lindquist ocean wave follower. (1975) (17546620234).jpg 1,462 × 2,540; 360 KB
-
 Analysis of the Lindquist ocean wave follower. (1975) (17546686864).jpg 2,576 × 1,578; 391 KB
-
 Analysis of the Lindquist ocean wave follower. (1975) (17546742024).jpg 2,512 × 1,306; 907 KB
-
 Analysis of the Lindquist ocean wave follower. (1975) (17546791054).jpg 2,848 × 1,800; 1.31 MB
-
 Analysis of the Lindquist ocean wave follower. (1975) (17548653883).jpg 2,592 × 1,952; 457 KB
-
 Analysis of the Lindquist ocean wave follower. (1975) (17548723923).jpg 2,944 × 1,710; 1.37 MB
-
 Analysis of the Lindquist ocean wave follower. (1975) (17548770143).jpg 2,072 × 3,178; 431 KB
-
 Analysis of the Lindquist ocean wave follower. (1975) (17981348798).jpg 1,792 × 2,604; 432 KB
-
 Analysis of the Lindquist ocean wave follower. (1975) (17981499588).jpg 1,636 × 3,040; 1.21 MB
-
 Analysis of the Lindquist ocean wave follower. (1975) (17981596180).jpg 1,454 × 3,080; 413 KB
-
 Analysis of the Lindquist ocean wave follower. (1975) (17981611560).jpg 1,766 × 2,568; 1.22 MB
-
 Analysis of the Lindquist ocean wave follower. (1975) (18142737546).jpg 1,150 × 3,140; 307 KB
-
 Analysis of the Lindquist ocean wave follower. (1975) (18142798666).jpg 2,036 × 2,644; 1.83 MB
-
 Analysis of the Lindquist ocean wave follower. (1975) (18142905026).jpg 1,604 × 3,076; 1.2 MB
-
 Analysis of the Lindquist ocean wave follower. (1975) (18165780882).jpg 1,314 × 2,698; 947 KB
-
 Analysis of the Lindquist ocean wave follower. (1975) (18165783502).jpg 3,040 × 872; 368 KB
-
 Analysis of the Lindquist ocean wave follower. (1975) (18169230335).jpg 2,720 × 896; 244 KB
-
 Analysis of the Lindquist ocean wave follower. (1975) (18170348381).jpg 1,882 × 2,732; 611 KB
-
 Analysis of the Lindquist ocean wave follower. (1975) (18170462181).jpg 2,544 × 1,790; 1.28 MB
-
 Analysis of the Lindquist ocean wave follower. (1975) (18170516771).jpg 3,024 × 1,018; 344 KB
-
 Analysis of the Lindquist ocean wave follower. (IA analysisoflindqu00bonn).pdf 1,116 × 1,595, 212 pages; 5.79 MB
-
 Annual data summary for 1992, CERC Field Research Facility (1995) (18236755268).jpg 1,666 × 2,514; 868 KB
-
 Annual data summary for 1992, CERC Field Research Facility (1995) (18237207100).jpg 1,662 × 2,506; 987 KB
-
 Annual data summary for 1992, CERC Field Research Facility (1995) (18398178346).jpg 1,662 × 2,518; 822 KB
-
 Annual data summary for 1992, CERC Field Research Facility (1995) (18398187936).jpg 1,662 × 2,506; 934 KB
-
 Annual data summary for 1992, CERC Field Research Facility (1995) (18420752292).jpg 1,670 × 2,520; 927 KB
-
 Annual data summary for 1994, CERC Field Research Facility (1996) (18424570145).jpg 2,002 × 2,876; 1.23 MB
-
 Annual data summary for 1995, CHL Field Research Facility (1998) (18236823140).jpg 1,674 × 2,530; 950 KB
-
 Annual data summary for 1995, CHL Field Research Facility (1998) (18238312449).jpg 1,688 × 2,532; 982 KB
-
 Annual data summary for 1995, CHL Field Research Facility (1998) (18424597765).jpg 1,674 × 2,528; 966 KB
-
 Antarctic bottom water fr.svg 745 × 470; 36 KB
-
 Antarctic bottom water hg.png 3,300 × 2,550; 517 KB
-
 Antarctic bottom water.svg 745 × 470; 42 KB
-
 Antarctic SSST.png 1,466 × 872; 22 KB
-
 Anti-cyclonic warm core eddy.png 1,028 × 774; 523 KB
-

-
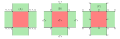 Arakawa grids used for OGCMs.svg 670 × 216; 39 KB
-
 Arctic profile hg.png 1,114 × 560; 147 KB
-
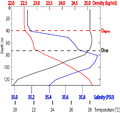
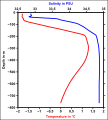 Arctic sea temperature salinity plot.svg 472 × 523; 49 KB
-
 Asphalt volcano2 h.jpg 1,554 × 1,192; 951 KB
-
 Atlantic beta.png 720 × 288; 20 KB
-
 Backcomp-clean.gif 400 × 400; 9 KB
-
 Backcomp-it.gif 400 × 400; 10 KB
-
 Backcomp-pt.gif 400 × 400; 9 KB
-
 Backcomp.gif 400 × 400; 13 KB
-
 Banner Pb GEOTRACES17.jpg 720 × 499; 122 KB
-
 Beta 30W.png 720 × 288; 22 KB
-
 BOP stack top kill mode plus broken riser.svg 1,424 × 1,223; 36 KB
-
 BrnBld BeringToFram-es.svg 650 × 200; 178 KB
-
 BrnBld BeringToFram.svg 650 × 200; 33 KB
-
 Canyó submarí.svg 1,191 × 842; 309 KB
-
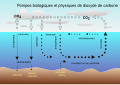
 Carbon cycle-cute diagram pt.svg 540 × 417; 135 KB
-
 Carbon cycle-cute diagram-zh-Hans.jpeg 540 × 417; 122 KB
-
 Carbon cycle-cute diagram.jpeg 540 × 417; 52 KB
-
 Cañón subamrino.svg 1,191 × 842; 377 KB
-
 Cemenet 2.png 670 × 670; 39 KB
-
 Cement 1.png 666 × 668; 42 KB
-
 Cement 3.png 668 × 666; 38 KB
-
 Change in total heat content of earth.svg 640 × 480; 28 KB
-
 Chantier sous-marin.jpg 537 × 827; 425 KB
-
 Chemical reaction at coast modified.png 1,105 × 580; 157 KB
-
 Chemoclines.png 408 × 256; 16 KB
-
 Cicle orogenic.PNG 1,790 × 2,490; 514 KB
-
 Circulation de Walker.png 590 × 413; 18 KB
-
 Circulation El Nino-(el).PNG 606 × 413; 19 KB
-
 Circulation El Nino.png 608 × 413; 16 KB
-
 Circulation La Nina-(el).PNG 606 × 413; 19 KB
-
 Circulation La Nina.png 606 × 413; 17 KB
-
 ENSO - El Niño-cs.svg 512 × 394; 22 KB
-
 ENSO - El Niño.svg 512 × 394; 21 KB
-
 ENSO - La Niña-cs.svg 240 × 185; 22 KB
-
 ENSO - La Niña.svg 240 × 185; 21 KB
-
 ENSO - normal-cs.svg 370 × 285; 23 KB
-
 ENSO - normal.svg 370 × 285; 22 KB
-
 Enso elnino.png 608 × 413; 17 KB
-
 Enso lanina.png 606 × 413; 18 KB
-
 Enso normal-el.PNG 606 × 413; 20 KB
-
 Enso normal.png 590 × 413; 19 KB
-
 Pacific Ocean ru.png 590 × 413; 19 KB
-
 CLAW hypothesis.jpg 738 × 599; 38 KB
-
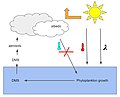
 CO2 pump hg as.svg 720 × 505; 46 KB
-
 CO2 pump hg-bn.svg 720 × 505; 47 KB
-
 CO2 pump hg-fr.svg 720 × 505; 46 KB
-
 CO2 pump hg-hi.svg 720 × 505; 48 KB
-
 CO2 pump hg-ru.svg 679 × 475; 8 KB
-
 CO2 pump hg-te.svg 720 × 505; 47 KB
-
 CO2 pump hg.svg 720 × 505; 46 KB
-
 CO2 pump hg.svg-mr.svg 720 × 505; 47 KB
-

-

-

-
-

-

-
 Comparison of predicted and observed tides at Monterey, California. (1973) (20047920334).jpg 3,104 × 1,558; 1.31 MB
-
 Comparison of predicted and observed tides at Monterey, California. (1973) (20047931194).jpg 1,554 × 3,110; 1.22 MB
-

-
 Comparison of predicted and observed tides at Monterey, California. (1973) (20482474788).jpg 3,104 × 1,552; 1.29 MB
-

-
 Comparison of predicted and observed tides at Monterey, California. (1973) (20644196176).jpg 3,040 × 1,556; 1.31 MB
-
 Comparison of predicted and observed tides at Monterey, California. (1973) (20644197736).jpg 3,104 × 1,552; 1.28 MB
-
 Comparison of predicted and observed tides at Monterey, California. (1973) (20677195981).jpg 3,104 × 1,550; 1.27 MB
-
 Comparison of predicted and observed tides at Monterey, California. (1973) (20677197651).jpg 1,552 × 3,112; 1.24 MB
-
 Continental and oceanic crust mk.png 2,887 × 1,750; 2.4 MB
-
 Continental and oceanic crust.png 952 × 577; 531 KB
-
 Continental shelf (PSF).png 601 × 396; 23 KB
-
 Continental shelf ca.png 568 × 274; 23 KB
-
 Continental shelf eu.png 456 × 180; 15 KB
-
 Continental shelf fr.png 456 × 180; 5 KB
-
 Continental shelf waves over a continental slope. (1969) (20683980145).jpg 3,136 × 1,826; 332 KB
-
 Cross Section of Atlantic Ocean 1872.tiff 3,170 × 1,259; 15.23 MB
-
 Cross.section.estuarine.front.png 1,857 × 866; 101 KB
-
 Dai,2003 fig2.png 424 × 534; 79 KB
-
 Dai,2003 table3.png 736 × 527; 109 KB
-
 Deep Sea Vent Chemistry Diagram workaround.svg 2,198 × 1,266; 149 KB
-
 Deep sea vent chemistry diagram.jpg 2,199 × 1,278; 1.17 MB
-
 Deepwater Horizon oil spill recovery context bigfont.svg 2,058 × 2,173; 72 KB
-
 Deepwater Horizon oil spill recovery context maxfont.svg 2,058 × 2,173; 84 KB
-
 Deepwater Horizon oil spill recovery context numbered.svg 2,058 × 2,173; 75 KB
-
 Deepwater Horizon oil spill recovery context.svg 8,234 × 8,693; 63 KB
-
-
 Diagenese recente.jpg 380 × 433; 49 KB
-
 Dibujo Corrientes geostróficas.png 1,844 × 1,454; 88 KB
-
 Dibujo Corrientes geostróficas.svg 744 × 1,052; 7 KB
-
 Dickinson gunn 2022 figure2 paneld.jpg 1,848 × 1,242; 2.47 MB
-
 Different littoral stages-fr.svg 829 × 151; 8 KB
-
 Diurnal Flow over a Ridge - NOAA-PMEL.gif 295 × 357; 4.2 MB
-
 Djup-lod.jpg 1,482 × 2,186; 259 KB
-
 DOC net production, transport and export in the ocean.png 663 × 801; 554 KB
-
 Dorsal oceanica.jpg 350 × 179; 14 KB
-
 Drake-Passage profile hg.png 1,155 × 806; 196 KB
-
 Echo Sounding USN.jpg 2,250 × 1,575; 329 KB
-
 Echo Sounding USN.PNG 1,073 × 751; 1.07 MB
-
 Echogram.svg 740 × 330; 94 KB
-
 Echolot.png 424 × 451; 60 KB
-
 Echolot.svg 500 × 500; 3 KB
-
 Echolot2.jpg 424 × 451; 16 KB
-
 Edge wave elevation.png 1,200 × 900; 50 KB
-
 Effect of near-surface temperature corrections.webp 986 × 760; 41 KB
-

-

-
 Eick svsd.png 1,350 × 975; 36 KB
-
 Eigenrays.jpg 1,438 × 1,052; 1.43 MB
-

-

-
 Electron Acceptor Cascade in Marine Sediments.PNG 598 × 372; 71 KB
-
 ENSO - El Niño-th.svg 512 × 394; 24 KB
-
 ENSO - La Niña-th.svg 240 × 185; 24 KB
-
 ENSO - normal-th.svg 370 × 285; 25 KB
-
 ENSO temperature and depth anomalies over time.png 1,328 × 770; 328 KB
-
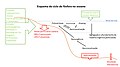 Esquema do ciclo do fósforo no oceano.jpg 1,280 × 720; 108 KB
-
 Esquema fluxo co2 oceano.png 938 × 462; 22 KB
-
 Estuarine fronts(tidal intrusion front).png 1,142 × 650; 52 KB
-
 Estuarine.ax.conv.front.png 2,815 × 1,727; 148 KB
-
 Etageslittoraux.jpg 527 × 304; 61 KB
-
 Evaporación agua.jpg 200 × 137; 18 KB
-
-
 Example blt 31Jan2002 Argo2.png 800 × 750; 43 KB
-
 Fasham Ducklow McKelvie 1990.svg 543 × 363; 29 KB
-
 FgAWI LagranianDrifter.svg 243 × 445; 20 KB
-
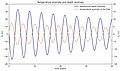 Figure oscillation.jpg 9,111 × 5,362; 2.25 MB
-
 Finite element grid around Terschelling.svg 358 × 358; 563 KB
-
 Fishing down the food web.jpg 5,433 × 3,675; 3.3 MB
-
 Fishing down the foodweb.png 5,433 × 3,675; 9.38 MB
-
 Floating loose mooring catenary inkscape.svg 744 × 680; 5 KB
-
 Floating loose mooring catenary plain.svg 744 × 680; 3 KB

.png)


_(16150649713).jpg)
_(16150651223).jpg)
_(16563300837).jpg)
_(16563305207).jpg)
_(16563307257).jpg)
_(16583004038).jpg)
_(16583012308).jpg)
_(16744695556).jpg)
_(16744700396).jpg)
_(16769500022).jpg)


_(17983360589).jpg)


_(17982814889).jpg)
_(17546819924).jpg)
_(17981542588).jpg)
_(17983188019).jpg)
_(18165835952).jpg)
_(18165841642).jpg)
_(18165857682).jpg)
_(18169403635).jpg)
_(18169420115).jpg)
_(18170563551).jpg)
_(17546620234).jpg)
_(17546686864).jpg)
_(17546742024).jpg)
_(17546791054).jpg)
_(17548653883).jpg)
_(17548723923).jpg)
_(17548770143).jpg)
_(17981348798).jpg)
_(17981499588).jpg)
_(17981596180).jpg)
_(17981611560).jpg)
_(18142798666).jpg)
_(18142905026).jpg)
_(18165780882).jpg)
_(18170348381).jpg)
_(18170462181).jpg)
_(18236755268).jpg)
_(18237207100).jpg)
_(18398178346).jpg)
_(18398187936).jpg)
_(18420752292).jpg)
_(18424570145).jpg)
_(18236823140).jpg)
_(18238312449).jpg)
_(18424597765).jpg)


_(19738621642).jpg)


.PNG)

.PNG)


_(20482370958).jpg)
_(20482398408).jpg)
_(20661179972).jpg)
_(20670413365).jpg)
_(20047908374).jpg)
_(20047916764).jpg)
_(20047920334).jpg)
_(20047931194).jpg)
_(20049551143).jpg)
_(20482474788).jpg)
_(20482499458).jpg)
_(20644196176).jpg)
_(20644197736).jpg)
_(20677195981).jpg)
_(20677197651).jpg)


.png)

_(20683980145).jpg)


_(20245167924).jpg)


_(20567135963).jpg)
_(21001460889).jpg)


_(1916)_(21243523986).jpg)
_(1916)_(21277846041).jpg)


.png)


_and_annual_average_(black_line)_of_global_upper_ocean_heat_content_for_the_0-700m_layer_between_1955-2008.gif)


_(18143074516).jpg)
_(17981156658).jpg)
_(18142737546).jpg)
_(18165783502).jpg)
_(18169230335).jpg)
_(18170516771).jpg)