Category:Meat statistics
Jump to navigation
Jump to search
Media in category "Meat statistics"
The following 63 files are in this category, out of 63 total.
-
 Animals-slaughtered-for-meat (OWID 0068).png 850 × 600; 58 KB
-
 Beef and buffalo meat consumption per person, OWID.svg 850 × 600; 23 KB
-
 Cereal distribution to food, animal feed and other uses, OWID.svg 850 × 600; 14 KB
-
 Cereals allocated to food, animal feed and fuel, World.png 3,400 × 2,400; 316 KB
-
 Chinese Pork Production and Consumption (11718363396).jpg 1,651 × 901; 211 KB
-

-
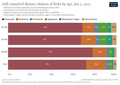 Dietary-choices-of-british-adults (OWID 0291).png 850 × 600; 75 KB
-
 Dietary-choices-of-british-adults.svg 850 × 600; 32 KB
-
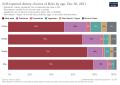
 Dietary-choices-uk (OWID 0292).png 850 × 600; 68 KB
-
 Energy efficiency of meat and dairy production, OWID.svg 850 × 600; 5 KB
-
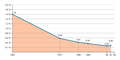 Fleischpreis-Verdienst.png 3,000 × 1,500; 115 KB
-
 Global meat consumption map.svg 2,560 × 1,314; 1.1 MB
-
 Global meat production.svg 850 × 600; 39 KB
-
 Global-meat-consumption-1961-2009.png 1,208 × 693; 50 KB
-
 Global-meat-production-by-livestock-type (OWID 0537).png 850 × 600; 79 KB
-
 Global-meat-projections-to-2050 (OWID 0533).png 850 × 600; 72 KB
-
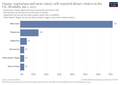
 Hypothetical-global-meat-demand (OWID 0503).png 850 × 600; 96 KB
-
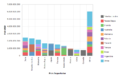
 Meat and Dairy CO2 Emissions - 20 largest emitters.png 2,066 × 1,351; 398 KB
-
 Meat Consumption in the U.S..jpg 396 × 380; 33 KB
-
 Meat production by livestock type, OWID.svg 850 × 600; 28 KB
-
 Meat production by region and production intensity in millions of tons.png 1,677 × 1,022; 106 KB
-
 Meat production, OWID.svg 850 × 600; 142 KB
-
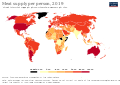
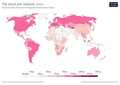
 Meat supply per person, OWID.svg 850 × 600; 141 KB
-
 Meat Supply per Person.svg 850 × 600; 164 KB
-
 Meat-production-tonnes (OWID 0662).png 850 × 600; 110 KB
-
 Meatproduction in Germany.svg 402 × 243; 53 KB
-
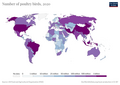
 Pays producteurs viande 2004.svg 479 × 338; 67 KB
-
 Per capita annual meat consumption by region.png 1,299 × 776; 107 KB
-
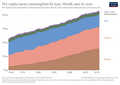
 Per capita meat consumption by type, OWID.svg 850 × 600; 15 KB
-

-

-
-
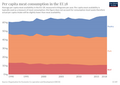 Per-capita-meat-eu28 (OWID 0754).png 850 × 600; 62 KB
-
 Per-capita-meat-type (OWID 0752).png 850 × 600; 81 KB
-
 Per-capita-meat-usa (OWID 0751).png 850 × 600; 62 KB
-
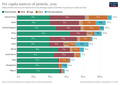 Per-capita-sources-of-protein (OWID 0856).png 850 × 600; 73 KB
-
 Pig meat per animal, OWID.svg 850 × 600; 140 KB
-
 Pig-livestock-count-heads (OWID 0847).png 850 × 600; 95 KB
-
 Pig-yields-meat-per-animal-in-hectograms-100-grams (OWID 0846).png 850 × 600; 94 KB
-
 Pigmeat production, OWID.svg 850 × 600; 141 KB
-
 Pigmeat-production-tonnes (OWID 0845).png 850 × 600; 107 KB
-
 Poultry meat per animal, OWID.svg 850 × 600; 140 KB
-
 Poultry production, OWID.svg 850 × 600; 141 KB
-
 Poultry-livestock-count (OWID 0814).png 850 × 600; 93 KB
-
 Poultry-production-tonnes (OWID 0812).png 850 × 600; 104 KB
-
 Poultry-yields-meat-per-animal (OWID 0813).png 850 × 600; 87 KB
-

-

-

-

-

-
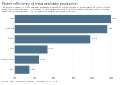 Protein efficiency of meat and dairy production, OWID.svg 850 × 600; 5 KB
-
 Schlachtungen in Deutschland.svg 364 × 201; 55 KB
-
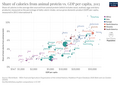 Share-of-calories-from-animal-protein-vs-gdp-per-capita (OWID 1005).png 850 × 600; 108 KB
-

-
-
 Spotřeba hovězího masa.png 800 × 566; 42 KB
-
 Total annual meat consumption by region.png 1,263 × 821; 81 KB
-
 Total annual meat consumption by type of meat.png 1,108 × 861; 82 KB
-
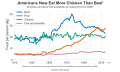 US Consumption of Meat, Poultry, and Fish.svg 900 × 540; 75 KB
-
 VegansByCountry.svg 790 × 510; 1.44 MB
-
 VegetariansByCountry.svg 790 × 510; 1.44 MB
-
 Výroba hovězího masa.png 800 × 566; 76 KB
.png)


.jpg)
_over_time_(1990%E2%80%932017).png)
.png)

.png)


.png)
.png)
.png)


.png)


,_OWID.svg)
,_OWID.svg)
.png)
.png)
.png)
.png)
.png)

.png)
.png)

.png)


.png)
.png)
.png)


.png)


