File:Patentanmeldungen pro 100000 EW.svg
Jump to navigation
Jump to search

Size of this PNG preview of this SVG file: 609 × 600 pixels. Other resolutions: 244 × 240 pixels | 487 × 480 pixels | 780 × 768 pixels | 1,039 × 1,024 pixels | 2,079 × 2,048 pixels.
Original file (SVG file, nominally 609 × 600 pixels, file size: 2.4 MB)
Captions
Captions
Add a one-line explanation of what this file represents
| Description |
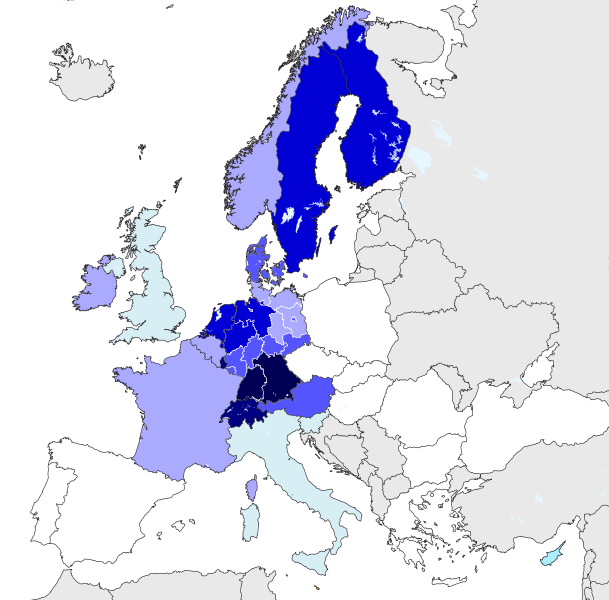
Deutsch: Europakarte der Patentanmeldungen pro 100.000 Einwohner (2014)
> 500
> 100
80–99
60–79
40–59
20–39
10–19
5–9
< 5 |
| Date | |
| Source |
This file was derived from: NUTS 1 regions EU-27.svg |
| Author | Kopiersperre (talk) |
| Permission (Reusing this file) |
This file is licensed under the Creative Commons Attribution-Share Alike 4.0 International license.
|
Data:
Land	Patente pro 100.000 EW	Patentanmeldungen 2014	EW in 1000
Liechtenstein	693	277	40
Baden-Wuerttemberg	137	14533	10631
Bayern	123	15533	12604
Schweiz	83	6833	8212
Luxemburg	82	463	563
Hamburg	46	807	1746
Niederlande	41	6844	16830
Niedersachsen	40	3137	7791
Nordrhein-Westfalen	40	7116	17572
Schweden	40	3837	9645
Finnland	40	2193	5430
Dänemark	35	1973	5660
Hessen	34	2042	6045
Rheinland-Pfalz	26	1031	3994
Thueringen	26	559	2161
Berlin	25	867	3422
Sachsen	24	968	4046
Österreich	23	1963	8580
Bremen	22	144	657
Saarland	22	222	991
Belgien	17	1900	11100
Schleswig-Holstein	16	462	2816
Frankreich	16	10.557	66318
Brandenburg	13	327	2449
Irland	13	608	4595
Mecklenburg-Vorpommern	11	169	1597
Sachsen-Anhalt	10	227	2245
Norwegen	10	525	5156
Großbritannien	7,3	4687	64500
Italien	5,9	3613	60789
Slowenien	6	123	2061
Zypern	6	47	779
Spanien	3,1	1456	46464
Estland	2,7	36	1313
Tschechien	1,6	167	10522
Polen	1,2	475	38486
Portugal	1,1	112	10602
Ungarn	1,1	110	9909
Griechenland	0,8	87	10816
Slowakei	0,5	28	5416
Bulgarien	0,4	32	7350
Rumänien	0,1	28	20000
File history
Click on a date/time to view the file as it appeared at that time.
| Date/Time | Thumbnail | Dimensions | User | Comment | |
|---|---|---|---|---|---|
| current | 10:13, 26 December 2022 | | 609 × 600 (2.4 MB) | Iktsokh (talk | contribs) | Correction of borders |
| 10:52, 10 June 2015 |  | 609 × 600 (2.41 MB) | Kopiersperre (talk | contribs) | {{Information |Description={{de|Europakarte der Patentanmeldungen pro 100.000 Einwohner (2014) {{legend|ff0000ff|> 500}} {{legend|000055ff|> 100}} {{legend|000080ff|80–99}} {{legend|0000aaff|60–79}} {{legend|0000d4ff|40–59}} {{legend|5555ffff|20... |
You cannot overwrite this file.
File usage on Commons
There are no pages that use this file.